

Hey everyone! Are you new to trading? If so, you’re likely navigating a maze of unfamiliar terms, strategies, and tools. However, beginners often face various types of difficulties when they first start trading. But one of the most daunting challenges for you guys is the inability to read trading charts.
As you know, trading charts are like a foundational step in ensuring success in your newly started blockchain journey. Trading charts are visual representations of market data that can seem overwhelmingly complex, filled with candlesticks, lines, and indicators. Putting their complexity aside, they surely play an essential role in this industry.
Before moving ahead, we would like to address some critical problems. If you’re unable to read trading charts, don’t feel embarrassed. You’re a beginner in this industry ready to unlock countless opportunities. So, stay confident and navigate this path without any stress.
Coming back to the topic,
Many of you might be facing several challenges when reading a trading chart. But don’t worry now! We’ve come up with a detailed blog post that breaks down the essentials of reading trading charts, demystifying the process so that you can make informed trading decisions. Whether you’re looking to understand the basics of chart types, identify patterns, or learn how to interpret various indicators, this guide will provide all the information you need to get started on your trading journey.
Introduction to Trading Charts
Trading charts are graphical representations of market data over a specific period. They provide traders with a visual way to analyze price movements, identify trends, and make informed decisions. Charts can be used to track various assets, including stocks, currencies, commodities, and cryptocurrencies.
Types of Trading Charts
There are several types of trading charts, each offering a different perspective on price movements. The most common types include:
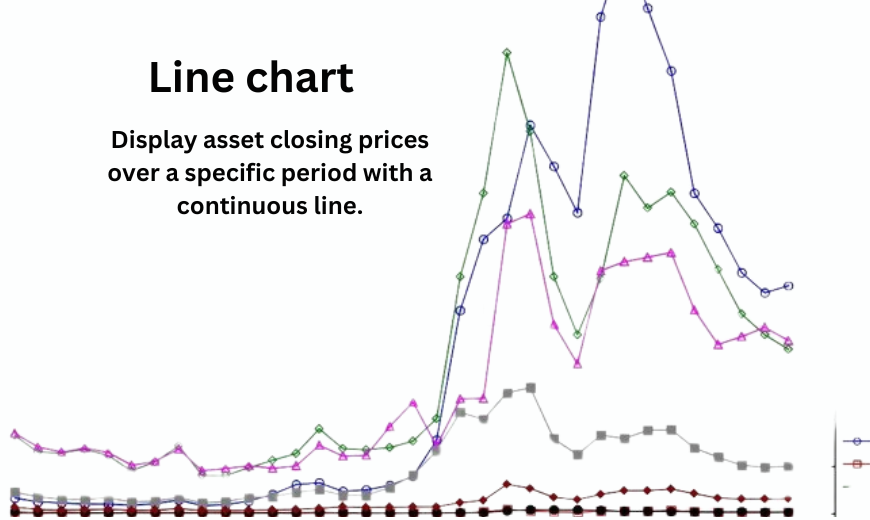
1. Line Charts
Line charts are the simplest type of trading chart. They display the closing prices of an asset over a specific period, connected by a continuous line. This type of chart is useful for identifying long-term trends.
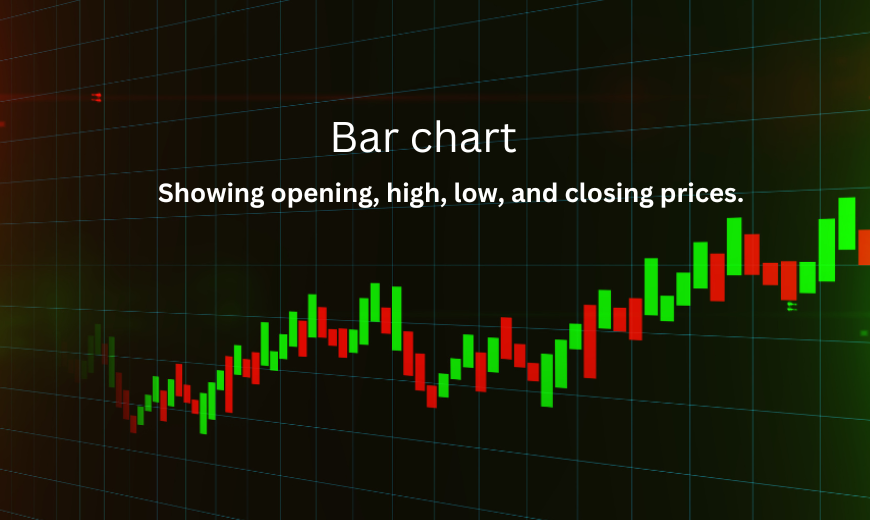
2. Bar Charts
Bar charts provide more information than line charts by displaying the opening, high, low, and closing prices for each time period. Each bar represents a single period, and the length of the bar indicates the range of prices.
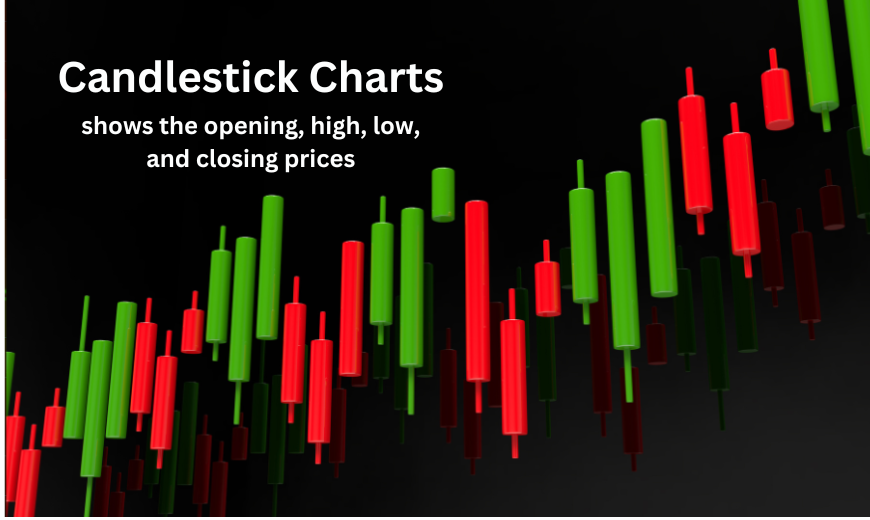
3. Candlestick Charts
Candlestick charts are similar to bar charts but offer a more visual representation of price movements. Each candlestick shows the opening, high, low, and closing prices for a given period. The body of the candlestick is colored to indicate whether the price moved up (bullish) or down (bearish).
Key Components of a Trading Chart
To read trading charts effectively, it’s important to understand the key components that make up these charts:
1. Price Axis
The vertical axis (Y-axis) represents the price of the asset. The range of prices shown on the axis can vary depending on the time frame and the type of asset being traded.
2. Time Axis
The horizontal axis (X-axis) represents time. Depending on the selected time frame, the time intervals can range from seconds to years.
3. Volume
Volume indicates the number of shares, contracts, or units traded during a specific period. It is usually displayed as a histogram at the bottom of the chart. High volume often indicates strong market interest and can confirm the strength of a price movement.
4. Trendlines
Trendlines are straight lines drawn on a chart to connect significant price points. They help identify the direction of the market trend. An upward trendline connects higher lows, while a downward trendline connects lower highs.
5. Support and Resistance Levels
Support and resistance levels are horizontal lines drawn on a chart to indicate price levels where the asset has historically had difficulty moving above (resistance) or below (support). These levels are crucial for predicting potential price movements.
Example of Support and Resistance Levels
| Level | Price (USD) |
| Resistance | 150 |
| Support | 100 |
Understanding Time Frames
Time frames are an essential aspect of trading charts. They determine the length of time represented by each data point on the chart. Common time frames include:
- Intraday (minutes to hours): Used for day trading and short-term analysis.
- Daily: Each data point represents one trading day.
- Weekly: Each data point represents one week.
- Monthly: Each data point represents one month.
Choosing the right time frame depends on your trading strategy. Short-term traders might prefer intraday or daily charts, while long-term investors might use weekly or monthly charts.
Common Chart Patterns
Chart patterns are formations created by the price movements of an asset. Recognizing these patterns can help traders predict future price movements. Here are some common chart patterns and what they indicate:
1. Head and Shoulders
The head and shoulders pattern consists of three peaks: a higher peak (head) between two lower peaks (shoulders).
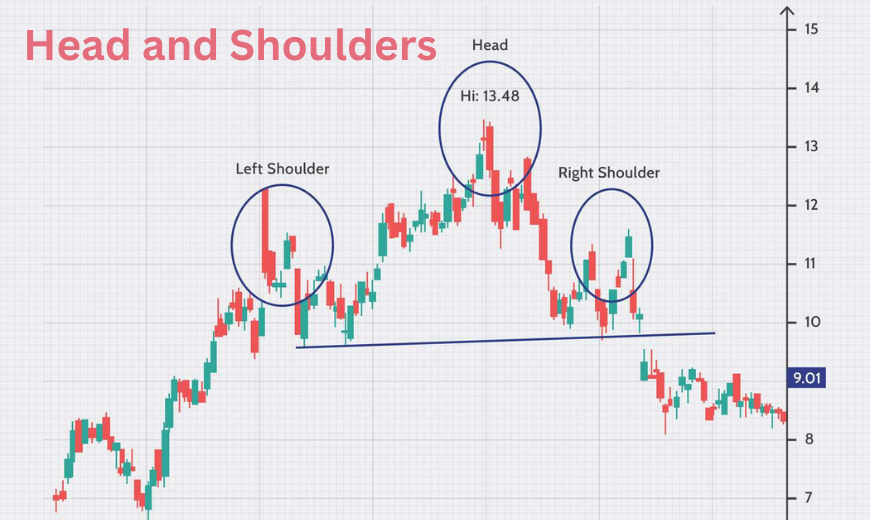
Indication: This pattern typically signals a reversal of the current trend. A head and shoulders top indicates a bearish reversal, while an inverse head and shoulders bottom indicates a bullish reversal.
2. Double Top and Double Bottom
Double Top
This pattern features two peaks at approximately the same price level.
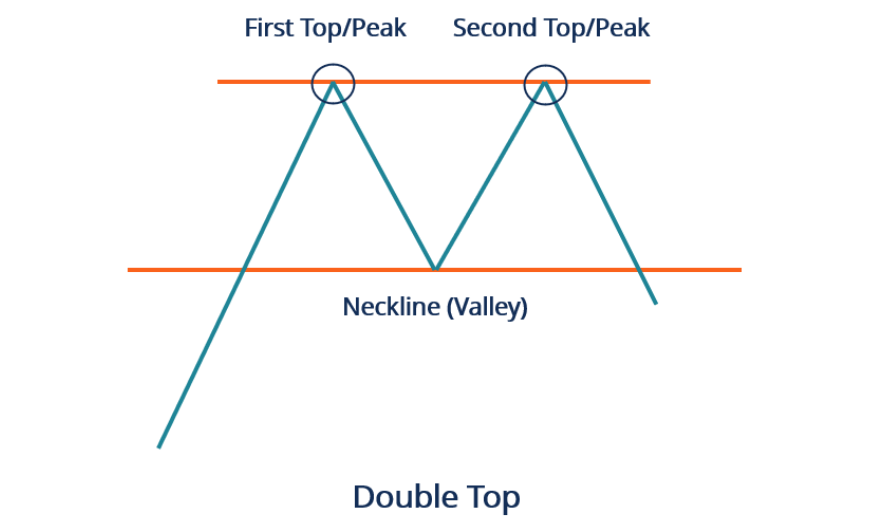
Indication: A double top signals a potential bearish reversal, suggesting that the asset price is likely to fall after failing to break through resistance twice.
Double Bottom
This pattern has two troughs at roughly the same price level.
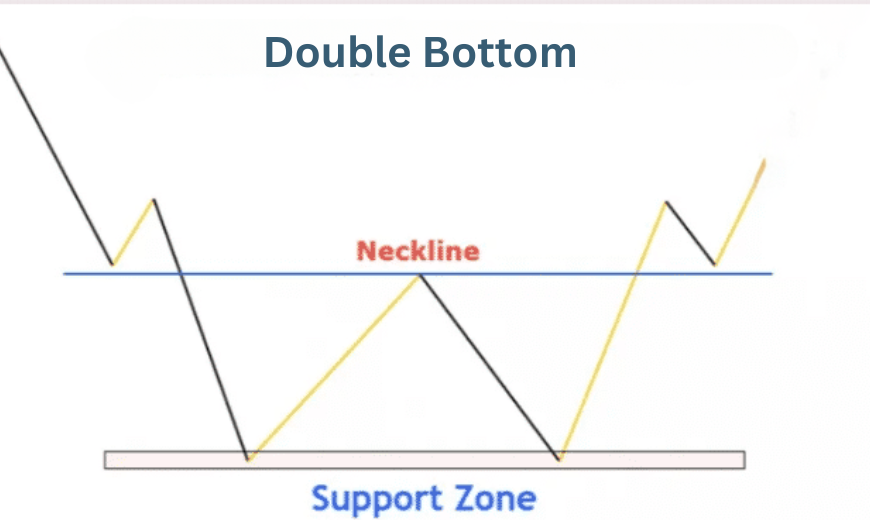
Indication: A double bottom signals a potential bullish reversal, indicating that the asset price is likely to rise after finding support twice.
3. Triangles
Ascending Triangle
An ascending triangle is formed by a horizontal resistance line and an upward-sloping support line.
Indication: This pattern is generally considered bullish, indicating that the price may break above the resistance level.
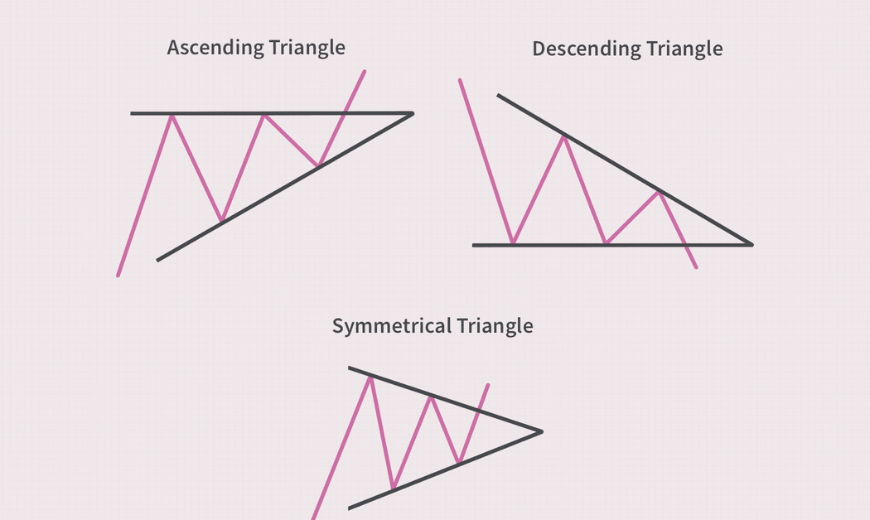
Descending Triangle
A descending triangle is formed by a horizontal support line and a downward-sloping resistance line.
Indication: This pattern is generally considered bearish, indicating that the price may break below the support level.
Symmetrical Triangle
A symmetrical triangle is formed by converging trendlines of support and resistance.
Indication: This pattern indicates a period of consolidation before a potential breakout in either direction. The breakout direction often follows the trend preceding the triangle.
4. Flags and Pennants
Flags
Flags are small rectangles that slope against the prevailing trend. They occur after a strong price movement and represent a period of consolidation.
Indication: Flags indicate a continuation of the previous trend. A bullish flag suggests the price will continue rising, while a bearish flag suggests the price will continue falling.
Pennants
Pennants are small symmetrical triangles that form after a strong price movement.
Indication: Like flags, pennants indicate a continuation of the previous trend. A bullish pennant suggests the price will continue rising, while a bearish pennant suggests the price will continue falling.
Common Chart Patterns:
| Pattern | Description | Indication |
| Head and Shoulders | Three peaks: higher peak (head) between two lower peaks (shoulders) | Bearish reversal (top) / Bullish reversal (bottom) |
| Double Top | Two peaks at approximately the same price level | Bearish reversal |
| Double Bottom | Two troughs at roughly the same price level | Bullish reversal |
| Ascending Triangle | Horizontal resistance line and upward-sloping support line | Bullish continuation |
| Descending Triangle | Horizontal support line and downward-sloping resistance line | Bearish continuation |
| Symmetrical Triangle | Converging trendlines of support and resistance | Potential breakout in either direction |
| Flags | Small rectangles that slope against the prevailing trend | Continuation of previous trend |
| Pennants | Small symmetrical triangles formed after a strong price movement | Continuation of previous trend |
Technical Indicators
Technical indicators are mathematical calculations based on the price, volume, or open interest of an asset. They provide additional information to help traders make decisions. Some popular indicators include:
1. Moving Averages
Moving averages smooth out price data to identify trends over a specific period. The two most common types are the simple moving average (SMA) and the exponential moving average (EMA).
2. Relative Strength Index (RSI)
RSI measures the speed and change of price movements. It ranges from 0 to 100 and is used to identify overbought or oversold conditions.
3. Moving Average Convergence Divergence (MACD)
MACD is a trend-following indicator that shows the relationship between two moving averages. It helps identify potential buy or sell signals.
4. Bollinger Bands
Bollinger Bands consist of a moving average and two standard deviations above and below it. They indicate the volatility of an asset and potential overbought or oversold conditions.
Example of RSI Indicator
| Period | RSI Value |
| 14 | 70 |
| 14 | 30 |
Practical Tips for Beginners
Reading trading charts can be overwhelming for beginners. Here are some practical tips to help you get started:
1. Start with Simple Charts
Begin with line charts or candlestick charts before moving on to more complex charts. This will help you get comfortable with basic price movements and trends.
2. Focus on One Asset
Instead of trying to analyze multiple assets at once, focus on one asset. Like, if you’re choosing Bitcoin, focus on this only. This will help you understand its behavior and make better trading decisions.
3. Use Multiple Time Frames
Analyze charts on different time frames to get a comprehensive view of the asset’s price movements. This can help you identify short-term and long-term trends.
4. Combine Chart Patterns and Indicators
Use chart patterns in conjunction with technical indicators to confirm potential trading signals. This can increase the accuracy of your predictions.
5. Practice with a Demo Account
Before risking real money, practice reading and interpreting charts with a demo trading account. This will help you build confidence and develop your skills without financial risk.
Wrapping Up
Understanding how to read trading charts is a fundamental skill for any trader or investor. By familiarizing yourself with different types of charts, key components, common patterns, and technical indicators, you can make more informed decisions and improve your trading outcomes. Remember to start simple, focus on one asset, use multiple time frames, and practice regularly to hone your skills.
By following this beginner’s guide, you’ll be well on your way to mastering the art of reading trading charts and enhancing your trading strategies. With this, we would like to end this blog post. Thanks for reading. We wish you a successful trading ahead!